Hydrogen Extremely Low Probability of Rupture (HELPR) is a modular, probabilistic fracture mechanics platform developed to assess the structural integrity of natural gas infrastructure for transmission and distribution of hydrogen natural gas blends. HELPR contains fatigue and fracture engineering models to allow fast computations while its probabilistic framework enables users to explore and characterize the sensitivity of predicted outcomes to uncertainties within the pipeline’s structure and operation.
HELPR development is supported by the U.S. Department of Energy’s (DOE) Office of Critical Minerals and Energy Innovation (CMEI) under the Alternative Fuels and Feedstocks Office (AFFO).
The HELPR software is available under the open-source 3-Clause BSD License. HELPR’s source code is primarily Python to enable user exploration and capability transparency.

Overview
HELPR includes the following features:
- Applicable to pressurized cylindrical shells
- Fast running, deterministic engineering models
- Fatigue life estimation
- ASME B31.12 Code Case 220 fatigue design curves with pressure, stress ratio, and hydrogen partial pressure dependence
- Track crack growth over time, assuming cyclic pressure loading
- Stress intensity factor calculations for both internal and external (longitudinal) elliptical shaped flaws based on solutions from API 579-1/ASME FFS-1
- Anderson Fracture Mechanics Textbook 2nd Edition and API 579-1 solutions available
- Failure assessment diagrams
- Probabilistic framework to provide predictions with uncertainty estimates
- Support for both characterized variability and unknown uncertainties
- User specified random pressure loading profiles
- Residual stresses using simplified residual stress intensity factor
- Sensitivity studies to understand impact of input parameters on predicted quantities of interest
- Crack evolution predictions saved to csv files for further investigation
Given a user-defined system, HELPR can be used to:
- Estimate remaining fatigue life for a set of operating conditions
- Explore the impact of transporting different volume fractions of hydrogen on a pipeline’s temporal structural integrity
- Determine which operational parameter variabilities have the most significant impact on a pipeline’s structural integrity
- Quantify the uncertainty in the remaining fatigue life based given uncertainty in system specifications
- Demo Jupyter notebooks of HELPR capabilities distributed with HELPR’s source code
Documentation
- Suggested citation for HELPR v2.1.0: Benjamin B. Schroeder, Cianan Sims, Benjamin R. Liu, Michael C. Devin, Bailey Lucero, and Charlene Palacio. HELPR (Hydrogen Extremely Low Probability of Rupture), Version 2.1.0. Sandia National Laboratories (March 31, 2026); software available at: https://helpr.sandia.gov.
- L. Ortiz and B. Schroeder: “HELPR Version 1.1.0 User Guide”, Sandia National Laboratories Technical Report, SAND2025-00615, January 2025.
- B. Schroeder, C. San Marchi, J. Ronevich: “HyBlend2 – HELPR User Meeting”, Pipeline Blending CRADA Meeting (Presentation), September 17, 2025, SAND2025-12821PE.
- B. Schroeder, M. Devin, C. San Marchi, J. Ronevich: “HyBlend2 – HELPR Software Overview”, Emerging Fuels Institute – Mega Call (Presentation), February 12, 2025, SAND2025-01688O.
- B. Schroeder and M. Devin: “HELPR v2.0.0 Update: Pipeline Blending CRADA Update”, Pipeline Blending CRADA Meeting (Presentation), January 15, 2025, SAND2025-00400O.
- B. Schroeder, C. San Marchi, J. Ronevich, M. Devin, J. Duell, and S. Potts: “Utilizing Probabilistic Analyses to Explore Performance Margins of Natural Gas Infrastructure for the Transport and Delivery of Hydrogen and Hydrogen Blends”, ASME Pressure Vessels & Piping Conference, July 29 – August 01 2024, Bellevue WA, SAND2024-09668C (Presentation), SAND2024-04359C (Proceedings Paper PVP2024-125226).
- B. Schroeder: “An Overview of the Hydrogen Extremely Low Probability of Rupture (HELPR) Toolkit for Probabilistic Structural Integrity Assessments When Transporting Hydrogen in Natural Gas Infrastructure”, Presentation for EPRI/Sandia Expert Workshop on Challenges and Solutions to Implementation and Reliable Operation of Large-Scale Gaseous Hydrogen Infrastructure at the ASME Pressure Vessels & Piping Conference, August 01 2024, Bellevue WA, SAND2024-09667C.
- B. Schroeder, R. Dingreville, C. San Marchi, and J. Ronevich: “Probabilistic Fracture Mechanics Toolkit for Hydrogen Blends in Natural Gas Infrastructure”. International Hydrogen Conference, Park City, UT, 17-20 September 2023, SAND2023-08941C.
- B. Schroeder, C. San Marchi, R. Dingreville, J. Ronevich: “Probabilistic Fracture Mechanics Toolkit for Hydrogen Blends in Natural Gas Infrastructure”, Emerging Fuels Symposium, 5-8 June 2023, Orlando FL, SAND2023-03992C.
- Documents for hydrogen-assisted fatigue crack growth relationships implemented in HELPR
- C. San Marchi, J.A. Ronevich, P. Bortot, M. Ortolani, K. Xu, M. Rana: “Technical basis for fatigue crack growth rules in gaseous hydrogen for ASME B31.12 Code Case 220 and for revision of ASME VIII-3 Code Case 2938-1”, ASME 2024 Pressure Vessels & Piping Conference, July 28 – August 01 2024, Bellevue WA, SAND2024-9864C (Presentation), SAND2024-11526C (Proceedings Paper PVP2024-12
- M. Agnani, J.A. Ronevich, C. San Marchi: “Comparison between fatigue behavior of pipeline steels in pure and blended hydrogen at different pressures”, ASME 2024 Pressure Vessels & Piping Conference, July 28 – August 01 2024, Bellevue WA, SAND2024-9679C (Presentation), SAND2024-9678C (Proceedings Paper PVP2024-123477)
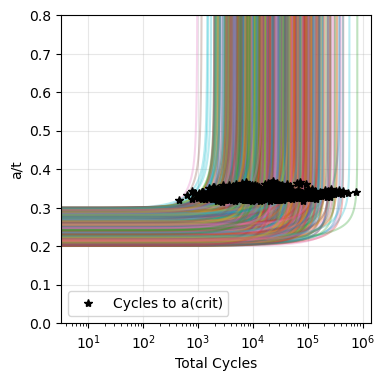
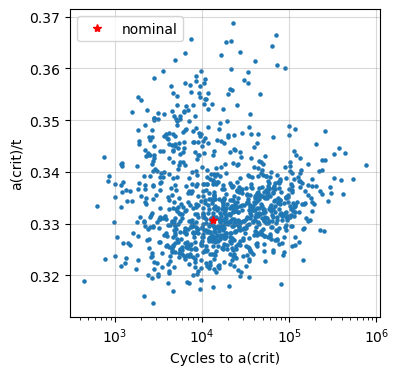
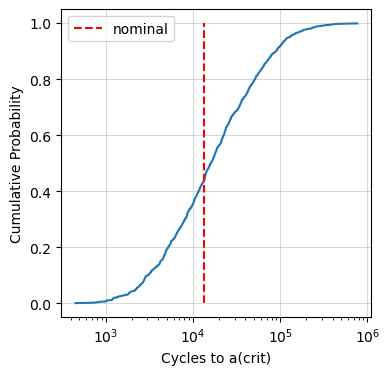
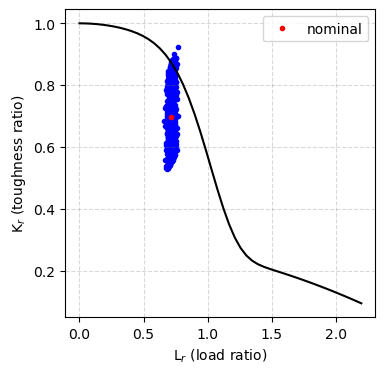
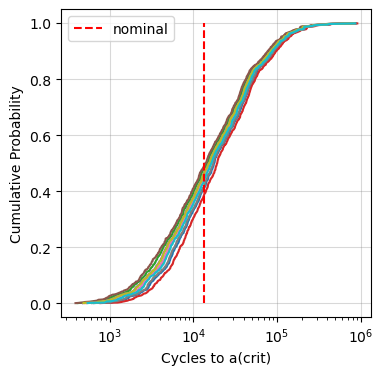
Sample Outputs
See examples of data below that were produced using HELPR.

© 2026 National Technology & Engineering Solutions of Sandia, LLC (NTESS). Under the terms of Contract DE-NA0003525 with NTESS, the U.S. Government retains rights in this software.
Contact
Benjamin Schroeder
HELPR Team Lead
bbschro@sandia.gov
Chris San Marchi
Hydrogen Materials Expert
cwsanma@sandia.gov
Joe Ronevich
Hydrogen Materials Expert
jaronev@sandia.gov